
Ensior's solutions, when combined with Power BI, can provide an organization with faster and better insights. In this blog, we'll take a look at how we can design standard financial reports.
The foundation is a Power BI dataset solution (SAP ECC, SAP Business One, Microsoft Dynamics) from Alistar, in which all the data loading mechanisms, modeling work, and various other intelligent features are already built in. In addition to all kinds of financial data, a Power BI dataset solution also contains data from other areas, such as operations, procurement, and sales. In this blog, we’ll take a closer look at designing standard financial reports, such as a trial balance and income statement, in Power BI. Of course, these types of standard reports can almost always be retrieved directly from the source system. However, organizations often want more than the standard overview provided, and further enriching the data can be a time-consuming and error-prone process.
Filter & Consolidate
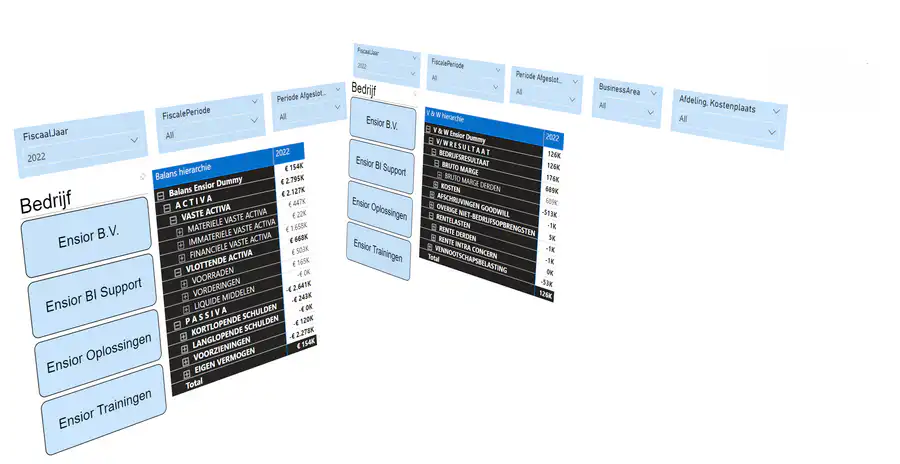
Often, there is still a desire to be able to filter these types of reports by more fields than the default options, or to implement Row Level Security so that certain individuals can only view data from their own unit or, for example, country/region. Another key requirement is the ability to consolidate these types of reports, especially when dealing with multiple accounting systems—which, in some software packages, are also stored in multiple databases. An overarching hierarchy for general ledger accounts can then be part of the solution when the hierarchies for different accounting systems are structured differently. See below for a Power BI example featuring a filter that allows different companies (accounting systems) to be consolidated.
Comparison with Previous Periods and Budgets
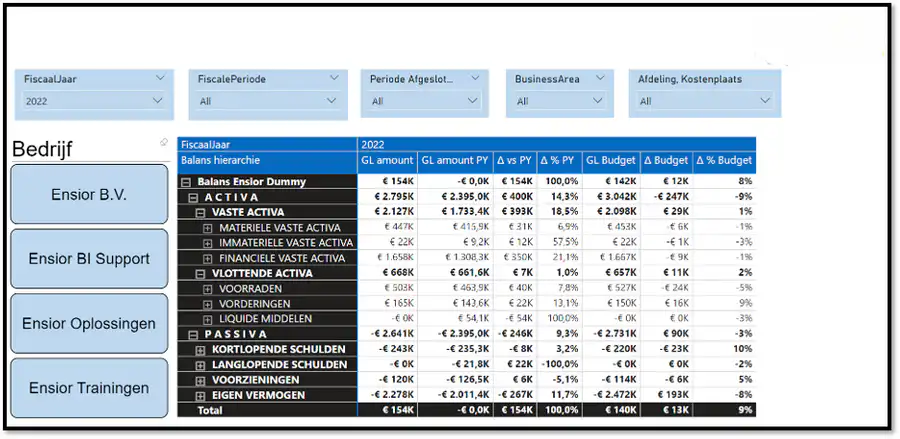
A second step that can be taken to make reports more transparent is to compare them with previous periods and budgets. In financial reports, comparisons with previous periods typically involve comparing the current (ongoing) year to the previous year or the current month to the same month a year earlier. These are standard calculations in our Power BI dataset solutions. For budgets, the source system often allows them to be recorded, and this information is then included in the solution. If budgets are maintained externally—for example, in an Excel file—they can easily be added to the underlying Power BI dataset. With this information, we can then create financial reports such as the one shown below.
Define Drill-Down and Drill-Through Paths
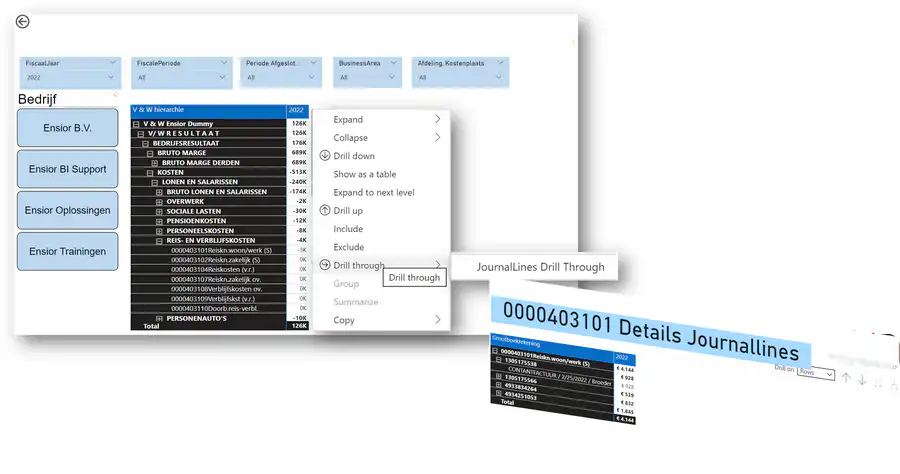
By including the required fields from the general ledger account hierarchy in your Power BI visual, you automatically have the ability to drill down to the lowest level. Often, there’s also a desire to drill down from a general ledger account to underlying entries, such as invoices or journal entries. A bit of intelligence built into the modeling process makes this possible—for example, as shown below, where you can drill down from a general ledger account to underlying journal entries.
Add charts
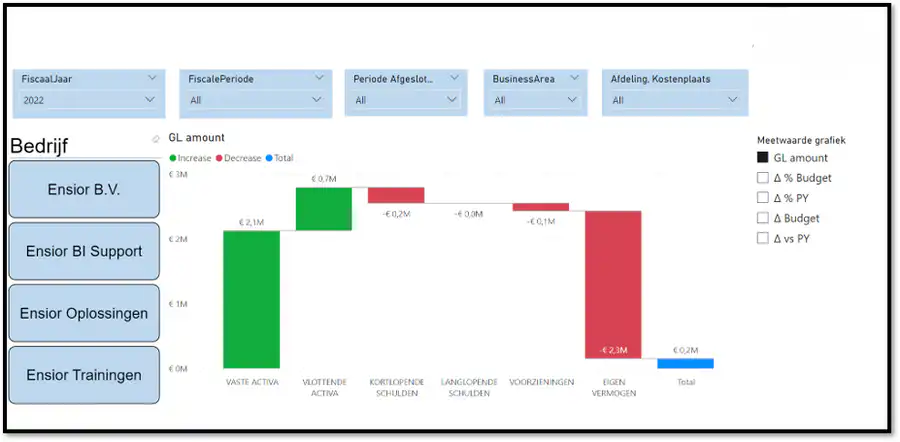
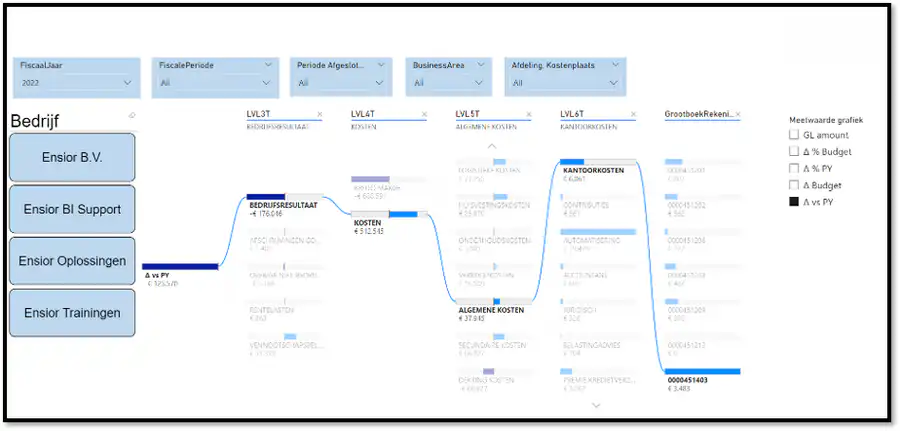
Not all charts in Power BI offer the same level of added value when it comes to presenting certain financial data in a useful way. However, charts often show ratios or outliers at a glance. The waterfall chart shown below displays increases and decreases in different colors. The drill-down capabilities and the ability to switch between metrics—allowing analysis based on different deltas—make this a powerful analytical tool. The same applies, more or less, to the “Decomposition Tree” visual, which is also very useful for analysis.
Define KPIs
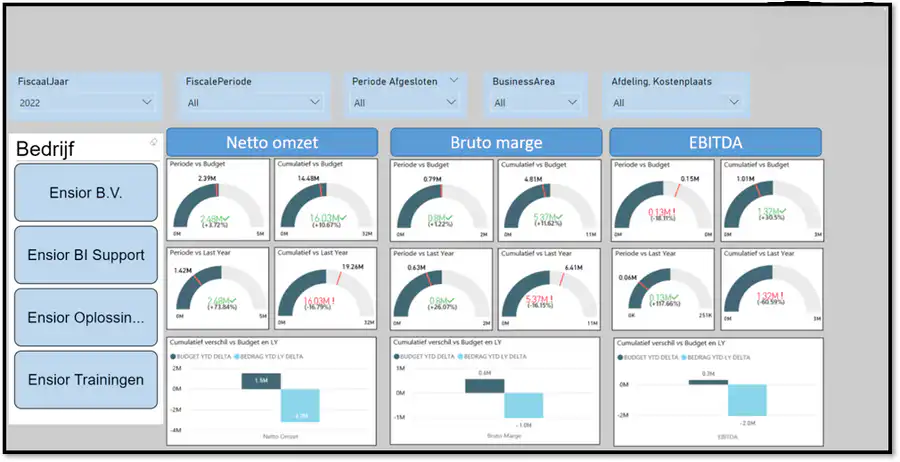
Now that we have variances in the model compared to previous periods and budgets, it’s also a logical step to define KPIs. Through various cross-sections and, if necessary, Row Level Security, the KPIs can be made available at different organizational levels. Below is an example of how KPIs can be structured.
Conclusion
When the underlying (Power BI) dataset is well-structured, it’s fairly easy to design the desired report in Power BI. Specifications and requirements regarding the format of financial statements may vary by organization, but the fundamentals generally remain the same.