
In this blog post, we’ll take a look at how to use Excel and PowerPoint in combination with Power BI. Creating a report in Power BI is often the best choice—after all, that’s what the tool was designed for. Still, using Excel for data analysis can be useful in some cases. Excel has about a billion users, so (almost) everyone here is familiar with it. PowerPoint is also a widely used tool, and screenshots of Power BI reports are often pasted into it. Below, we’ll explore how to do this more effectively with the new Power BI add-on for PowerPoint.
Architecture
A common architecture is shown in the image below, in which the Power BI dataset(s) serve as the basis for a Power BI report or an Excel file. The Power BI dataset is the in-memory model into which one or more data sources have been loaded. The model includes, among other things, the relationship definitions between tables and pre-calculated metrics. The desktop and online tools in Power BI and Excel can then connect directly to the Power BI dataset.
Analysis in Excel
People often ask whether data from a Power BI report can be exported to an Excel file. This is possible for any visual in a Power BI report, and Power BI lets you choose whether to export the aggregated data or the underlying data. For the latter option, you must explicitly check a box in the Power BI report to enable it. The downside of exporting is that it involves repetitive manual work and may run up against the export limit of 150,000 rows. A better option is to connect directly to the Power BI dataset(s) from within Excel.
Excel connection to a Power BI dataset
There are two ways to create an Excel connection to a Power BI dataset. You can do this from the Power BI service by selecting “Analyze in Excel,” or directly from Excel by selecting “From Power BI” under “Get Data.”.
When you connect from Excel, you can choose which Power BI dataset to use to create a pivot table. The availability of Power BI datasets in Excel depends on the permissions you have in the Power BI service. Build permissions on a Power BI dataset are required. The pivot table using a Power BI dataset works just like any other dataset and requires no further explanation. However, there are a few general points to keep in mind:
- In a Power BI report, numeric fields can easily be converted to aggregated measures (sum, average, etc.), but the Excel pivot table requires predefined measures. So make sure these have been created in the Power BI dataset.
- The maximum amount of data is 2 GB. Filters must then be applied to prevent errors.
Publishing an Excel Workbook to the Power BI service
If you need to share the Excel file with other colleagues, you can publish it to the Power BI service. The advantage is that all BI content is then centralized in a secure online environment, and interacting with an Excel workbook in PowerBI.com is similar to using Excel Online. You also have the option to pin a selection from an Excel workbook to a Power BI dashboard. Of course, you can also save the Excel workbook to a network drive or in SharePoint, for example, but others can only use it if the appropriate permissions have been granted in Power BI.
Power BI Reporting in PowerPoint
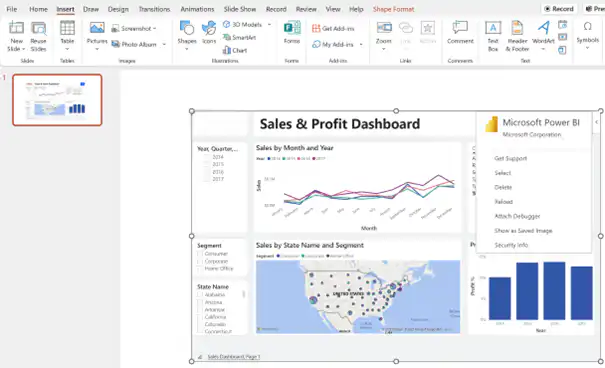
Figures are often presented to management in PowerPoint, accompanied by the necessary commentary. Certain report elements are then copied from a Power BI report and pasted into the PowerPoint report. Recently, it has become possible to embed a Power BI report as an add-in in PowerPoint, eliminating the need for this cut-and-paste process. To do this, you need the free Microsoft Power BI add-in for PowerPoint.
When using the Power BI add-in, you will be prompted for the Power BI report URL. You can copy this URL when you open the report in the Power BI service. If desired, you can also create bookmarks in the Power BI report so that the Power BI report always opens in PowerPoint with a specific selection.
When the Power BI report is embedded in PowerPoint, all interactive features remain available. Actions such as filtering, drilling down, and zooming in on a single report element are still possible. You can share the PowerPoint presentation using the various standard methods, but others can only use the Power BI report if they also have access to it on Powerbi.com. Alternatively, for an embedded Power BI report, you can enable the “Show as Saved Image” option.
Conclusion
Analysis in Excel and the Power BI add-in for PowerPoint are useful features that make integration with Microsoft Office applications much easier. However, you should always carefully weigh the pros and cons of building a report in Excel versus building it in Power BI.