

Business Intelligence with Power BI
Business Intelligence has become an indispensable part of modern business operations. It’s all about transforming data into actionable insights. This gives you insight into the performance of the various business units (Purchasing, Sales, Finance, HR, etc.). By presenting this information clearly in dashboards, you get a cross-section of the organization at a glance. The tool used for this is Power BI. With this data, an organization can make better decisions, identify opportunities, and make predictions. However, this didn’t happen overnight; the pioneering journey mentioned earlier forms the foundation of this tool.
We’re speaking with Leo Oost, director and owner of Econsultancy. Together with consultant and BI specialist Sunil Girdhari of Alistar, Leo was involved in the early stages of Power BI’s development a few years ago. Leo explains: “From within the Exact environment, we eventually also Exact Synergy ”We purchased it and integrated all our business processes into it. At one point, I wanted to use our numbers to provide direction. With Synergy, you can create really great pivot analyses and reports, but it doesn’t capture the imagination quite as much as Power BI.” It all started at Econsultancy during meetings with management. As creative director, Leo was able to express himself through beautiful dashboards that provided clarity for the entire management team.
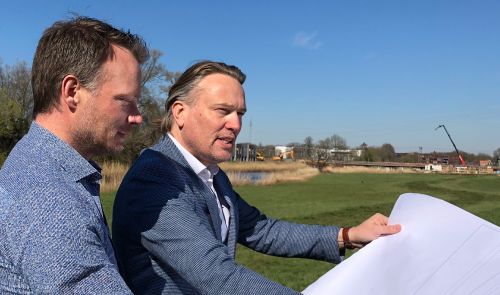
“With Synergy, you can create really great pivot analyses and overviews, but it doesn't capture the imagination quite as much as Power BI“
L. Oost | Director/Owner | Econsultancy
Predictive Management
In the collaboration between Sunil and Leo, setting up Exact Synergy And to address the need for greater insight by transforming data into actionable information, Sunil drew on his BI expertise to dive into the Power BI project. This resulted in several dashboards linked to various data sources from Econsultancy. The request came from the client; the solution came from Alistar. But together, they turned it into an increasingly effective, predictive tool.
Leo: “We started by putting all the data into Exact Synergy to enter. That way, you gradually build up a database. It grows over the years. Next, it’s naturally interesting to use that historical database to analyze the current situation. With Power BI, you can apply all kinds of filters, which provides valuable insights. If you want to set a course for the company, it’s very helpful to look at where you’ve come from, where you are now, and use that to sketch out a vision for the future.
We’ve started sharing this throughout the entire organization. In our case, with five locations. This allows us to share the necessary source data with each location manager, but only for that specific location and the information relevant to that manager. This works very simply by applying a different filter—or, in our case, displaying a different product assortment. But it can also be done by cost center. There are many possibilities; everyone has their own perspective.”
What do you want to measure and find out?
Econsultancy now has 16 Power BI dashboard components on a single dashboard. This approach works well for them. For example, there is a Power BI dashboard for the soil department, one for the archaeology division, one for each location, and one for the entire company.
Can you go too far with that, too? Leo says: “Where you can go too far is in drawing conclusions. You always have to ask yourself: Where do these numbers come from, anyway? What are we actually measuring? What do we want to get out of this? We once looked at employee turnover, but we forgot to factor in the reasons for people leaving. Then you end up making assumptions that aren’t accurate.”.
”So we involved HR in the process and included the reason for departure in the overview. That way, you can implement any necessary improvements, because you're using the right data to measure them."
Milestones Along the Way
Leo has just started creating a forecast based on historical data. “We have nearly 200 employees, each with their own target. We also have a budget. We’ve combined all of this into a Power BI report called ‘Finance Forecast.’ Every month, we record everything here—for example, all sales invoices. That way, you can already see what was achieved in January and what still needs to be done in the remaining months.”.
On top of that, there are also the so-called seasonal trends—government agencies experience peaks at different times than other businesses. Combined with the trend over the past three years, we can already make some predictions about what the coming year will look like. That’s really fun to do, because it’s very solid and therefore actually accurate. So you can really make predictions based on historical data.
”This idea occurred to me. I'll run it by our in-house IT specialist first, and then I'll present it to Sunil. He'll see if it's feasible. The great thing is that he always points out things I hadn't thought of. That's how we keep each other on our toes, and that's how great initiatives like this come about."
BI expertise truly runs through the veins of Alistar’s consultants, enabling them to push the boundaries of the systems together with the client. Leo explains: “We’re a young team and growing fast, so it’s great when a consultant grows with us. It started with an installation, then a migration, and finally a completely new tool. It’s truly a custom solution that we’re fine-tuning together to get the most out of the software.”
Innovative Partner
Leo describes Alistar as a partner that thinks innovatively alongside the client. “We’re often very driven ourselves and speak passionately about our needs. As a consultant, it’s easy to go along with that and implement it as is. But what’s much better, of course, is to take a step back and ask probing questions about the ‘why.’”.
”In our field, we need to do the same: ask follow-up questions and investigate before we take any action. Alistar does that, too: asking the right questions, listening carefully, and not just going along with the conversation."
Power BI for Executives and Management
At Econsultancy, the executive team and management use Power BI. At the employee level, insights are shared via screenshots or summaries, mainly because the interpretation is very important.
Leo: “You have to know exactly what you’re looking at and where it comes from. I keep saying this, but it really is that important. For example, we used to show issued invoices, but now we only want to show the invoices that have been posted from Exact Globe show. So you have to pay close attention to which numbers you use. We figure this out together with Alistar in a playful way. Sometimes you see something that needs to be adjusted. If we can’t handle that internally, we bring Sunil in. He takes a closer look and knows exactly what’s possible and what isn’t. That’s how we achieve the best possible result together. The visualizations also make it easier to discuss the data. New management members need some time to get used to it, but once they understand what they’re seeing, it really comes to life.”
Wishes for the Future
Econsultancy and Alistar still have many plans for the future. There is Exact Synergy They’ve created a great planning system for all the fieldwork involved in conducting Econsultancy’s soil survey. They’re also hard at work planning bat surveys, but that still requires a lot of customization.
For Power BI, the focus remains on optimizing the current dashboards and expanding them to include customer relationship management and marketing.
We asked Leo if he had any tips for companies considering using Power BI. His answer was: “Start with very simple reports, such as your employees’ vacation days. That way, you can get used to the system and learn how to work with it. Once you’ve mastered the technology, you can start looking at financial matters.”.
”You can do a lot on your own, but eventually you'll hit a wall and have to start tapping into databases. That's when you really need a smart partner like Alistar. It's a real leap forward in terms of time, insight, and predictive power!"
“BI expertise truly runs through the veins of Alistar’s consultants, enabling them to push the boundaries of the systems together with the client.”.
L. Oost | Director/Owner | Econsultancy
About Econsultancy
Econsultancy is an independent engineering firm that carries out projects on behalf of government agencies, the private sector, and individuals in the fields of soil, aquatic environments, water, infrastructure, archaeology, ecology, the environment, and land use. Their scope of work is not limited to the technical aspects of the environment. You can also turn to them for questions regarding policy, legal, financial, or organizational matters.
When carrying out projects, their top priority is customer satisfaction with quality, price, and service.
Start your own data journey in Power BI
Want to excel like Econsultancy by using Power BI? See how you can analyze, predict, and make decisions based on your data.