
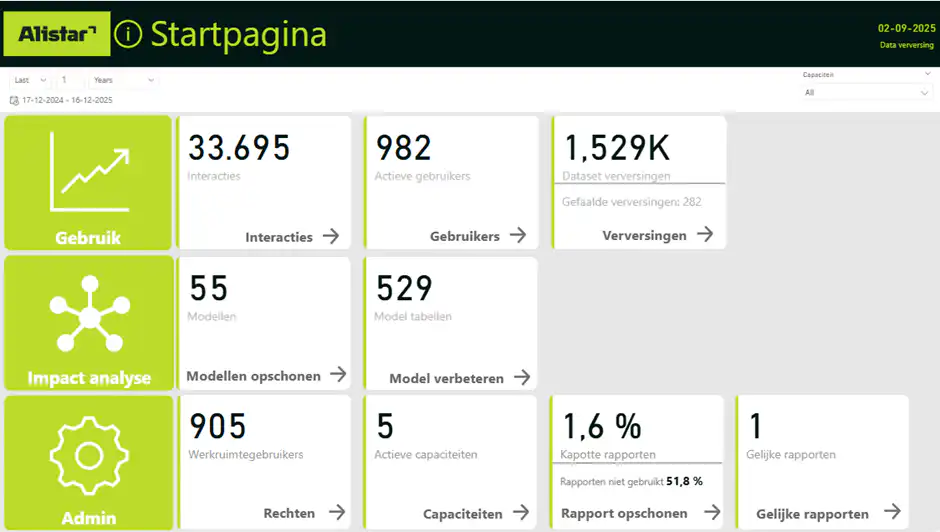
BI Insight provides a single, centralized dashboard for comprehensive governance of your Power BI environment. The solution offers in-depth insights into reports, workspaces, and data models for data cleansing, data lineage, and impact analysis.
Disclaimer: All names and dates in the screenshots are fictitious and do not correspond to any real people.
Benefits of BI-Insight:
- Power BI Governance in a Single Dashboard
- Detailed insight into Power BI usage, including inactive users
- Trend analyses based on historical usage data storage
- Impact analysis at the model-object level rather than (only) at the report-model level in Microsoft
- Insights updated daily; new errors from yesterday are immediately visible today.
- Semantic model as the basis for custom reports
- Overview of the permissions structure for workspaces (transferred from Entra ID groups)
- Alerts indicating which reports are (partially) broken
- Data Lineage
- Works in both Power BI Service and Power BI Report Server
- Automatic PBIX Backups
Architecture
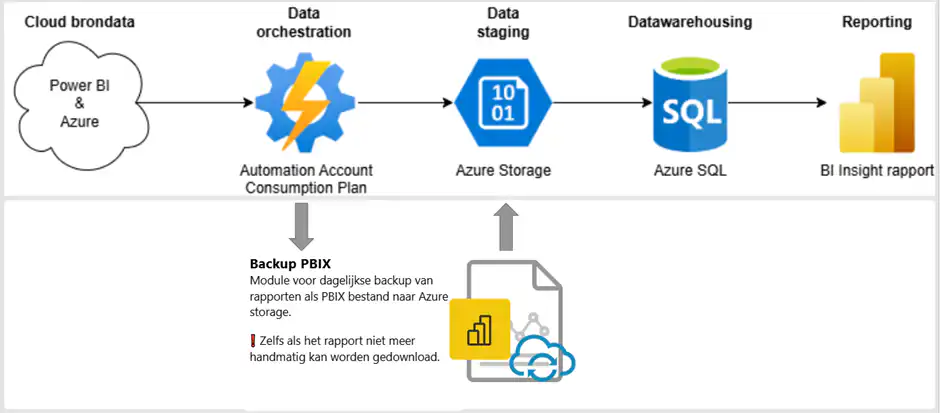
BI-Insight combines multiple data sources into a single overview. Using smart BI techniques, APIs, and our Data Automation Solution, we collect and link data about your semantic models and their usage across all reports. In Power BI, you get a clear overview of report usage, workspaces, permissions, and semantic model objects.
The solution can be implemented quickly and is built on a flexible architecture with a small footprint. The data warehouse can be added to an existing data warehouse or run in Azure SQL. The BI-Insight report can be hosted in a Pro, Premium Per User, or Fabric Capacity-backed workspace.
BI-Insight supports semantic models using Fabric Capacity, Premium Per User, Azure Analysis Services, and On-Premise SQL Server Analysis Services.
BI Insights for Your Organization
In the following section, we’ll take a closer look at the value BI-Insight brings to your organization. Each section is illustrated with real-world examples showing how BI-Insight provides valuable insights.
Automatic Backups
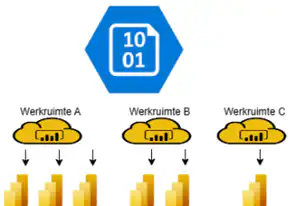
BI-Insight includes a backup module that automatically maintains a PBIX backup of all reports in your tenant. This module also works for reports that can no longer be downloaded manually. The PBIX files are stored in an Azure Storage container, grouped by workspace. By making smart use of the report metadata, we can process only new and modified objects daily after an initial full backup.
Interactions
Highlights
- Identify usage trends.
- Identify reports and dashboards that are rarely or never used.
- Traffic in the BI environment.
- Monitor interactions with the environment (such as exports and downloads).
Within your BI environment, having a good understanding of how the environment is used is important for managing it effectively. With the Interactions insights, you can see which reports and dashboards are being accessed and which ones are not. It’s also possible to gain insight into all kinds of other interactions, such as exporting data or downloading reports.
Use Cases
Identify usage trends
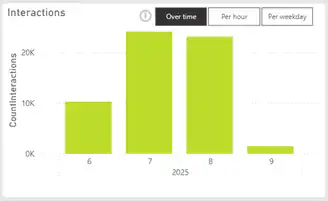
By building a history and plotting it over time, you can gain insight into usage trends. Plotting usage over time also allows you to identify seasonal patterns, which helps ensure you don't accidentally delete a report that is extremely important only during year-end closing.
When you launch a new, alternative version of a report alongside an old one, you can also effectively monitor whether users are actually switching to the new report and which users might still need help with the transition.
Identify reports and dashboards that are rarely or never used
By analyzing usage data, you can quickly identify reports and dashboards that are popular or, conversely, rarely accessed—and that may be removed. By using dynamic hierarchical slicers, a user can quickly switch between exploring specific workspaces or the entire tenant.
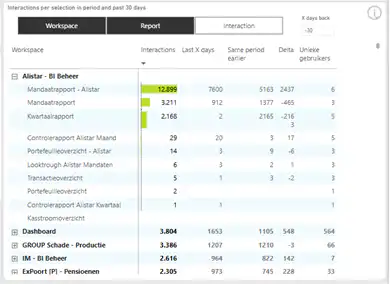
We see that the cash flow statement is not being used. We can check with the key users to see if this report can be streamlined. The Mandate Report – Alistar is the most frequently used report in this workspace, but the Mandate Report is still being consulted. Is this a new version, and do any users still need to be migrated?
Traffic BI Environment
By comparing interactions against the day of the week or the hours of the day, you can identify the peak times of usage. This can be used, for example, to determine when underlying resources—such as a Fabric Capacity or an Analysis Services instance—need to be scaled up. By identifying when a report is typically not in use, you can also better plan the rollout of a new version.
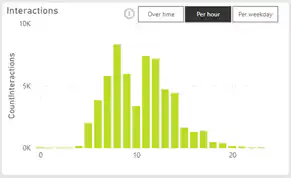
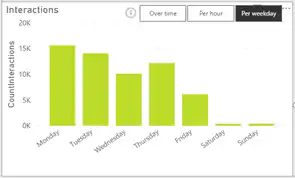
Interactions by the hour and by day of the week. We see a dip in interactions around 10 a.m., and usage tends to decline slightly toward the end of the week.
Exporting Sensitive Data
By monitoring the ExportData and DownloadReport interactions, we can gain insight into what data is being extracted from the Power BI environment. This may be a reason to strengthen security measures for the various export options.
Users
Highlights
- Insight into usage by specific users or departments.
- Understanding key users.
- Insights into users who actually use the environment very little.
Ultimately, the users are the reason you have a BI environment. They use the reports and dashboards to gain insights into the organization.
Use Cases
Insight into usage by specific users or departments
You can see, for each user, what actions they have performed within the Power BI environment. You can see which reports a user frequently views, as well as the reports and dashboards that are rarely viewed. By sorting the list by the fewest interactions, you can quickly see which users have not yet found their way around your Power BI environment.
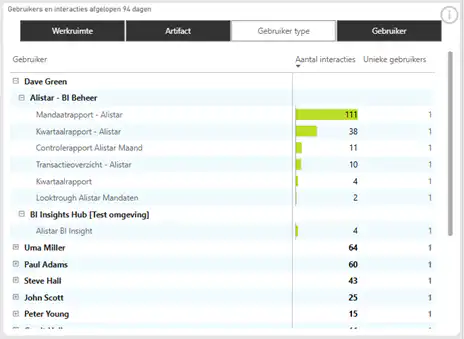
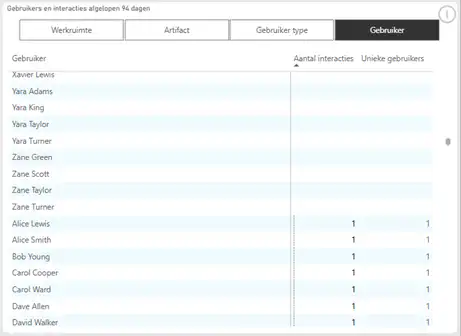
On the left, we can see that Dave Green has viewed objects in two workspaces and that the Mandate Report – Alistar is his most frequently used report. On the right, we see an overview of our users who have not yet viewed a report.
Rights Management
Highlights
- Who has access to a workspace, and what are their permissions?
- Transitive Access
Permissions in Power BI can be granted through a combination of direct access and Entra ID groups. With Entra ID groups, it is also possible for groups to be nested multiple levels deep within other Entra ID groups. Users can be granted access to a workspace at various levels (Administrator, Contributor, Member, or Viewer). Within a semantic model, users can also be assigned one or more roles, potentially with row-level security, which further restricts access to the data in a report.
Use Cases
Overview of the Complete Legal Structure
With BI-Insight, you can easily get a complete overview of the permissions structure. By combining the Graph API with the Fabric API and the XMLA endpoints, we can see for each user which workspaces they are authorized to access and which data they can view. This is fully transitive, so even if a user has access through various nested Entra ID groups, this information is clearly visible.
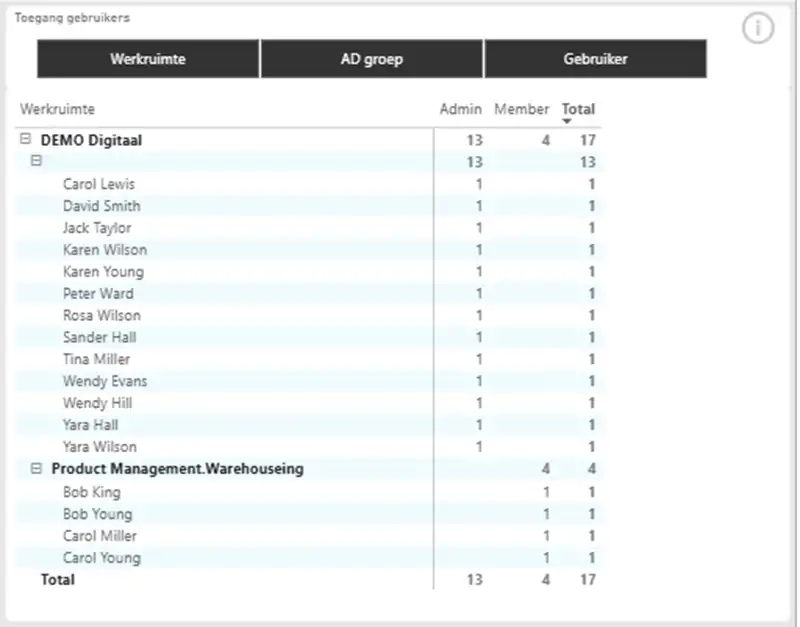
Overview of all workspaces and the various roles available. For example, we see that Carol Lewis has direct admin access to the DEMO Digitaal workspace, while Bob King has access via the Entra ID group "Product Management.Warehouseing Member.".
Overview of Internal and Guest Accounts
Sometimes, in addition to internal accounts, you also have guest accounts in your tenant. Using BI-Insight, you can quickly see what permissions these guest accounts have. Combined with the overview above, you can quickly filter, for example, to see all workspaces where a guest account is an admin.
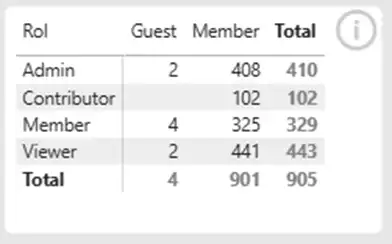
We see that we have 4 unique guest accounts in our Power BI tenant and 901 internal accounts with different levels of access.
Fabric Capacities and Premium Per User
Highlights
- Quick overview of all fabric capacities.
- Overview of Fabric Capacity, Premium Per User, and Pro Workspace Allocations.
- Overview of the status of available fabric capacities.
Within a Power BI environment, you can have a combination of multiple Fabric Capacities, Premium Per User, and Pro licenses active at the same time. These can then be assigned to different workspaces—for example, to ensure the correct SKU is available for the processes in the workspaces, or to allocate costs. A Fabric license under an F64 SKU can also be paused to save costs when it is not needed. It is also possible for a user to activate a temporary trial license for Fabric (unless you block this in your tenant settings).
Use Cases
Overview of Allocated Resources per Fabric Capacity License
You assign a Fabric Capacity to one or more workspaces. Everything in these workspaces then uses a portion of the Fabric Capacity’s computing power when they are active. For example, when executing a Fabric Pipeline, running a query against an Onelake table, or viewing a report. By keeping a clear overview of the workspaces and artifacts assigned to a Fabric Workspace, you can effectively balance the workload.
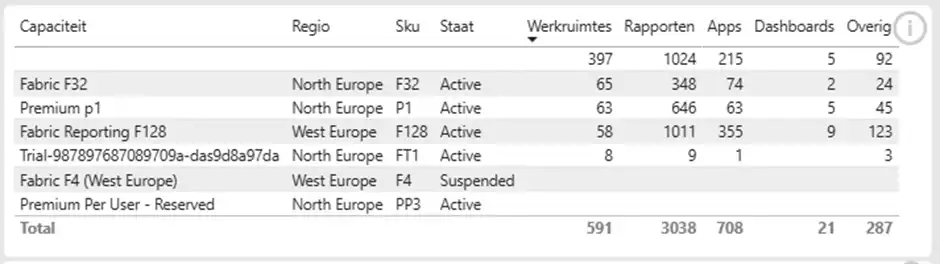
Overview of all active Fabric Capacity and Premium Per licenses that the workspaces are running under. The empty row represents the Pro workspaces.
View the Status of Fabric Capacities
Suppose you've assigned an SKU with a lower Fabric Capacity to a development workspace. This SKU only needs to be active when reports are being developed. You can quickly check whether it is indeed turned off. You'll also get an easy-to-read overview of all trial licenses and the workspaces where they are active.
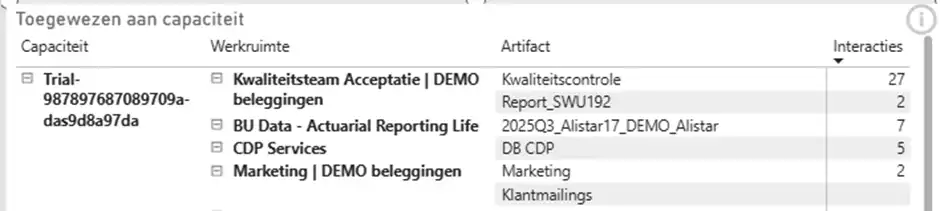
Overview of the workspaces covered by the trial license and the number of interactions that have occurred on each object in the workspace.
Reports
Highlights
- Identify broken reports
- Detailed overview of each object used in the report.
- Identify potentially duplicate reports
BI-Insight retrieves the metadata for all reports in the tenant. This metadata provides valuable insights for both report management and report development. By making smart use of the available APIs, BI-Insight only needs to retrieve the metadata for the entire tenant once. After that, only the metadata for new or modified reports is retrieved on a daily basis.
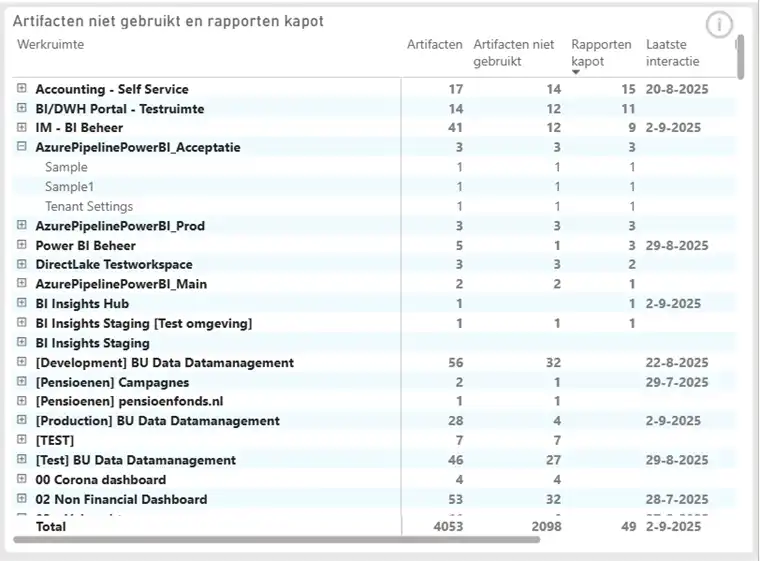
Overview of all workspaces and reports. At a glance, you can see how many reports are not being used, how many reports contain errors, and when the last interaction with each report occurred.
Use Cases
Identify broken reports
With BI-Insight, you can proactively identify reports in which at least one component is no longer functioning before users encounter the issue. Each report is scanned for objects that no longer exist in the underlying model and have not been created as standalone objects within the report itself. The internal status of each object is also checked to ensure it does not contain any error messages. The overview also includes a direct link to the report so that errors can be resolved quickly.

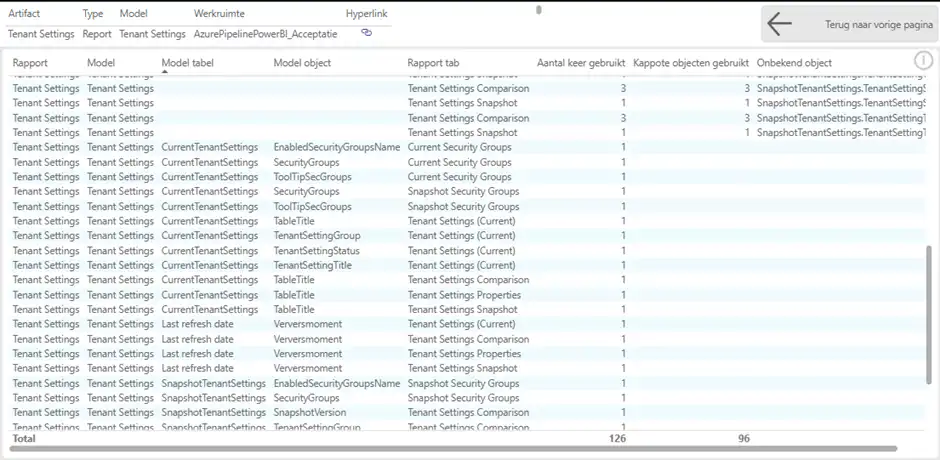
An overview of all objects used in the Tenant Settings report and the specific tab on which they appear. We see that there are 4 objects that no longer exist in the underlying data model and therefore cause an error in the report.
Detailed overview of each object used in the report
When developing a report, it can be helpful to see which model objects are already in use and on which tab they appear. This allows you to quickly determine whether you’re already providing certain information. Also, if you want to adjust the definition of a specific measurement, for example, it’s helpful to see which parts of your report this will affect.
Identify potentially duplicate reports
As a BI environment grows, multiple versions of the same report may be created. BI-Insight identifies these reports and groups them into report sets for further analysis.
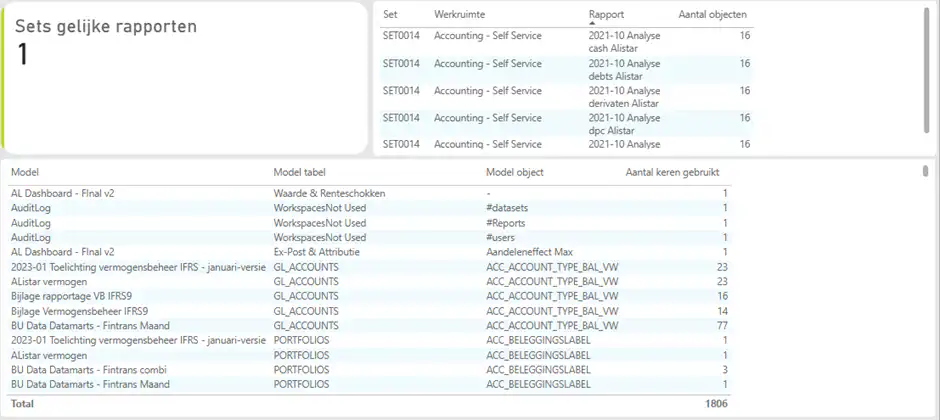
SET0014 contains 5 reports with similar content. These reports could potentially be combined into a single report with a slicer to arrive at the same insights. The table below shows which model objects are used.
Models
Highlights
- Impact Analysis of Existing Reports
- Identifying Broken Model Objects
- Cleaning Up Models
BI-Insight also retrieves metadata from all semantic models. By intelligently combining this metadata with the metadata from the reports, we can effectively manage the data lineage of the models in our tenant. This allows us to identify (partially) broken reports before they affect a user and to conduct a thorough impact analysis whenever we want to implement a change to a model.
Use Cases
Impact Analysis of Existing Reports
When you plan to modify existing objects in a semantic model, it’s important to conduct a thorough impact analysis in advance on all reports that will be affected by the change. For example, if you’re going to change the definition of a measure or the name of a filter object. With BI-Insight, we generate an overview for each semantic model object of all reports and specific tabs where that object is used. This way, you always know in advance what the impact of a change will be.
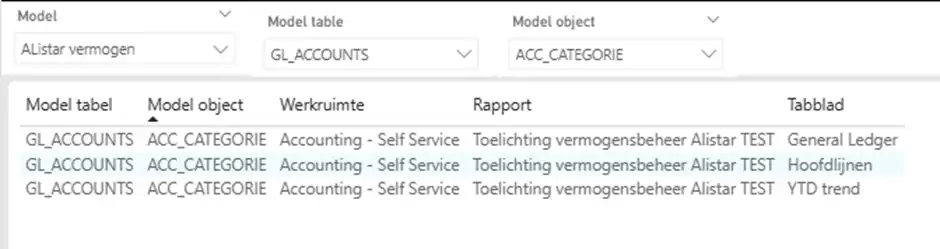
We want to modify the Accounting category (ACC_CATEGORY). The impact analysis shows that it is used in only one report across the General Ledger, Headings, and YTD Trend tabs.
Identifying Broken Model Objects
Every object in a semantic model has an internal status that verifies its validity. If an object contains an error, it will still be available but will generate an error message during use or while loading the data. For example, a calculated column that references a nonexistent object or a measure with an error in the DAX. With BI-Insight, you can run a scan on each model to identify the objects that contain an error.
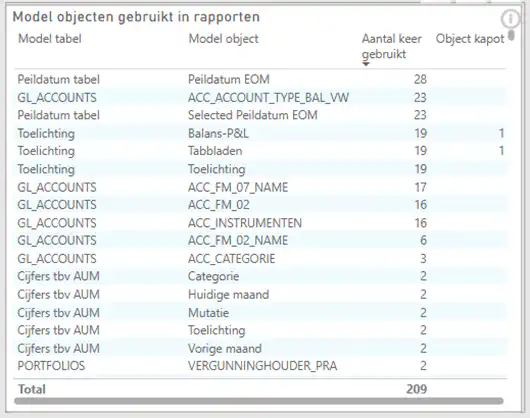
In the selected model, the "Balance Sheet-P&L" and "Sheets" objects from the "Notes" table contain a definition error.
Cleaning Up Models
Developing a model is an ongoing process. Over time, objects may be created in the model that are no longer relevant. When it comes to data objects, this means they consume valuable resources, both when loading your model and during its use. And outdated measures make it harder for report builders to quickly assemble the right data. BI-Insight provides you with the tools to analyze each model and identify these objects so they can be cleaned up if necessary. Because the VertiPaq engine can handle large amounts of repeated data in a data column very efficiently, the number of unique values is also displayed for these objects.
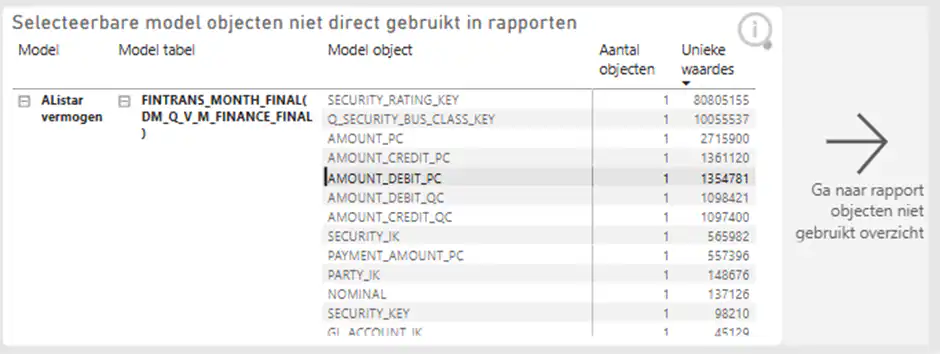
We see an overview of all objects by table and the number of unique values stored in the VertiPaq engine for each object.
Demo
Are you excited about using BI-Insight for your organization? Then contact Alistar right away to request a demo. We'd love to show you the added value we can bring to the management of your BI environment!