
The Power of Data Analysis in Logistics
The combination of Power BI and Exact ERP is a game-changer for logistics companies, as it enables them to identify trends, forecast demand, and pinpoint bottlenecks in the process.
Would you like to know how to stay ahead of the curve within your logistics organization and ensure optimal processes? In this blog, we’ll tell you more about using Power BI for logistics, how you can optimize logistics operations with Exact Software and Power BI, and what types of reports and analyses you can use.
- The Benefits of Power BI for Logistics Organizations
- Logistics Power BI Dashboards from Exact Software
The Benefits of Power BI for Logistics Organizations
Inventory management, demand forecasting, and process optimization are common challenges within a logistics organization. When using Power BI, the focus is, on the one hand, on making data-driven decisions and, on the other hand, on providing insight into operational metrics. This offers the following benefits:
Data Visualization
Data from the entire logistics process is converted into interactive visualizations. This allows you to quickly identify trends, issues, and opportunities within your data, leading to more informed decision-making.
Operational Insight
Power BI allows you to monitor real-time data based on KPIs you define. It’s like inserting a thermometer into your core processes, keeping you immediately informed of what’s happening and how it impacts the organization.
Data Integration
The software integrates seamlessly with various data sources, including databases, Excel files, and cloud-based systems. This means you can centralize data from multiple systems, resulting in a consolidated view for analysis and reporting.
Customize and analyze it yourself
The power of Power BI lies in its ability to let users create custom dashboards tailored to their specific needs. Whether you’re focused on monitoring delivery times, analyzing supply chain performance, or tracking inventory turnover—as long as the data is available, you can design dashboards and analyses that meet your requirements.
Logistics Power BI Dashboards from Exact Software
The strength of Exact Software for logistics is that it brings together challenges such as warehouse management, order processing, and delivery visibility within a single, centralized package. Data from Exact Software can be fully visualized and analyzed within Power BI.
Based on our experience working with logistics clients, we have built the following dashboards in Power BI, among others:
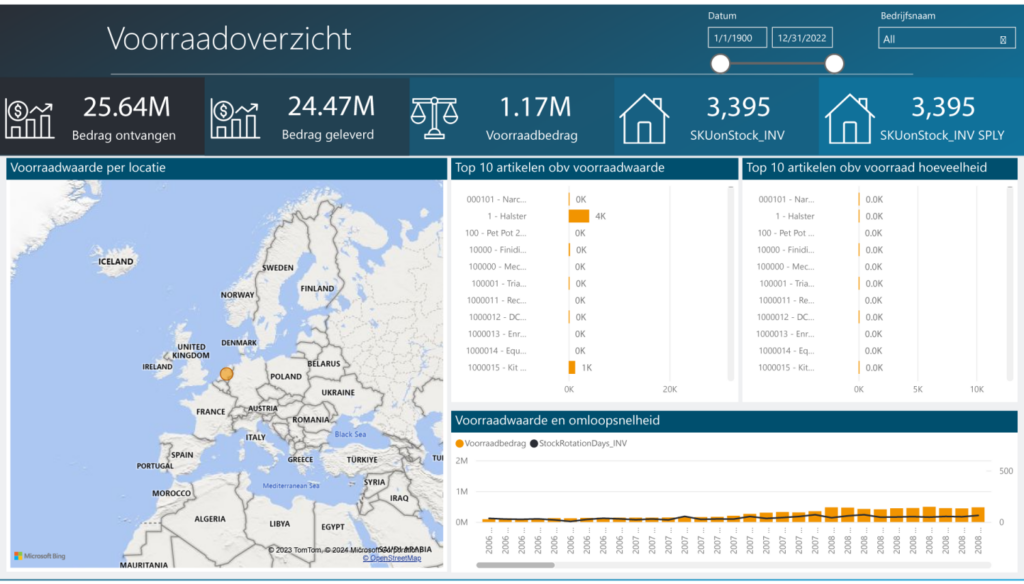
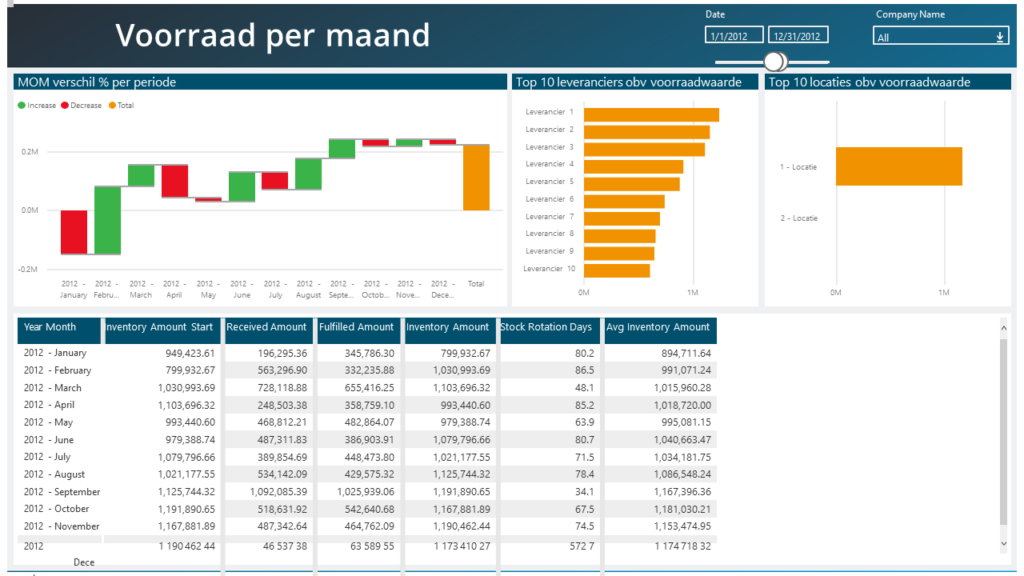
Inventory Overview
Complete visibility into changes in inventory value and turnover rate by item, time period, or location. This allows you to accurately track inventory down to the transaction level.
In the images below, you can see two dashboards based on data from Exact Globe:
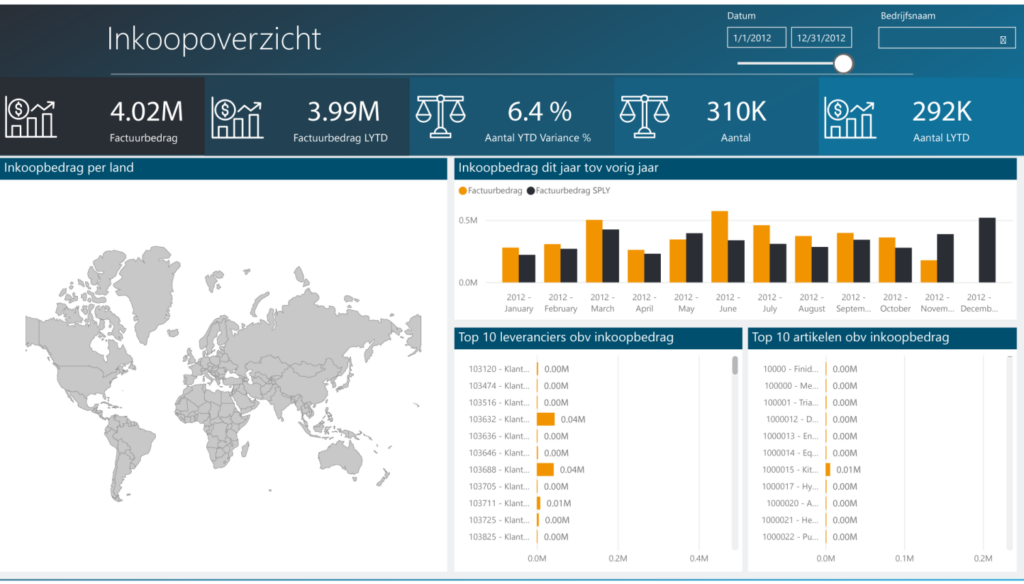
Purchasing Summary
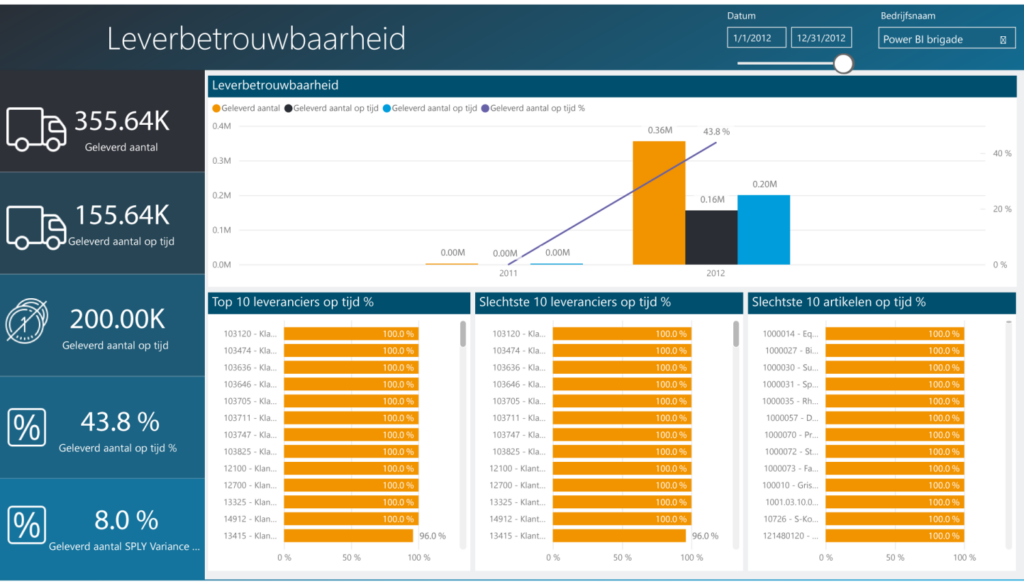
Insight into the entire procurement process within the organization. Gain insight into quantities, discounts, and incoming and outgoing goods, as well as, for example, supplier reliability. This enables you to conduct data-driven procurement.
Some examples from the procurement dashboard based on data from Exact Globe are:
These are just a few examples of logistics dashboards you can build using data from Exact Globe. Power BI also gives you the freedom to create your own dashboard or analysis based on your specific needs.
Want to know more?
Our Power BI specialist, Sunil, would be happy to work with you to build a dashboard tailored to your needs. Please feel free to contact him!

Sunil Girdhari