
Microsoft Copilot In Excel, the integration of artificial intelligence (AI) is transforming the way you manage data. This introduction to Copilot in Microsoft Excel walks you through the extensive features and capabilities that help you streamline data analysis, management, and visualization. Copilot combines the power of technology with ease of use and helps you create complex formulas, generate insights, and automate tasks. Discover how you can use Copilot for Excel as your personal AI assistant for data management.
Python
Even without any programming knowledge, you can perform advanced analyses, such as making predictions, conducting risk analyses, and identifying trends. All you have to do is ask what you want to know, for example: “What are the revenue trends over the past 5 years?” Copilot will then immediately generate the analysis, complete with charts and tables in a separate folder so the data doesn’t get lost. You can also make changes to the Python code. This makes Copilot in Excel a powerful tool for professionals who want to quickly gain insight into their data without spending hours manually entering formulas or setting up complex datasets.
Microsoft Copilot Features in Excel
With Microsoft Copilot in Excel, you have access to various features, including:
- Data Analysis: Copilot helps you analyze the data in your Excel spreadsheets and identifies trends and outliers.
- Generating Insights: Generate insights from all data or specific columns or rows, and visualize those insights in charts or pivot tables.
- Focusing on the Essence: Use Copilot to filter and sort data.
- Creating Formulas: Let Copilot help you create calculations and formulas.
- Creating Charts and Visualizations: Visualize your data in charts or pivot tables to analyze insights visually.
- Marking Dates: Copilot uses conditional formatting to highlight data in your table.
- Cleaning and Validating Data: Keep your data clean with the help of Copilot.
How does Microsoft Copilot work in Excel?
Copilot in Excel can be found on the ribbon under the ‘Start‘. It’s important to know that you can only use the Copilot chatbox if your document is saved in the cloud at OneDrive or SharePoint. In addition, the data must be in a table format be set up to use Copilot.
Please note: Copilot in Excel is sometimes limited to tables with a maximum of 2 million cells. Some prompts Tasks such as generating formulas, highlighting data, sorting, or filtering have no limits, but they may take longer for Copilot to complete.
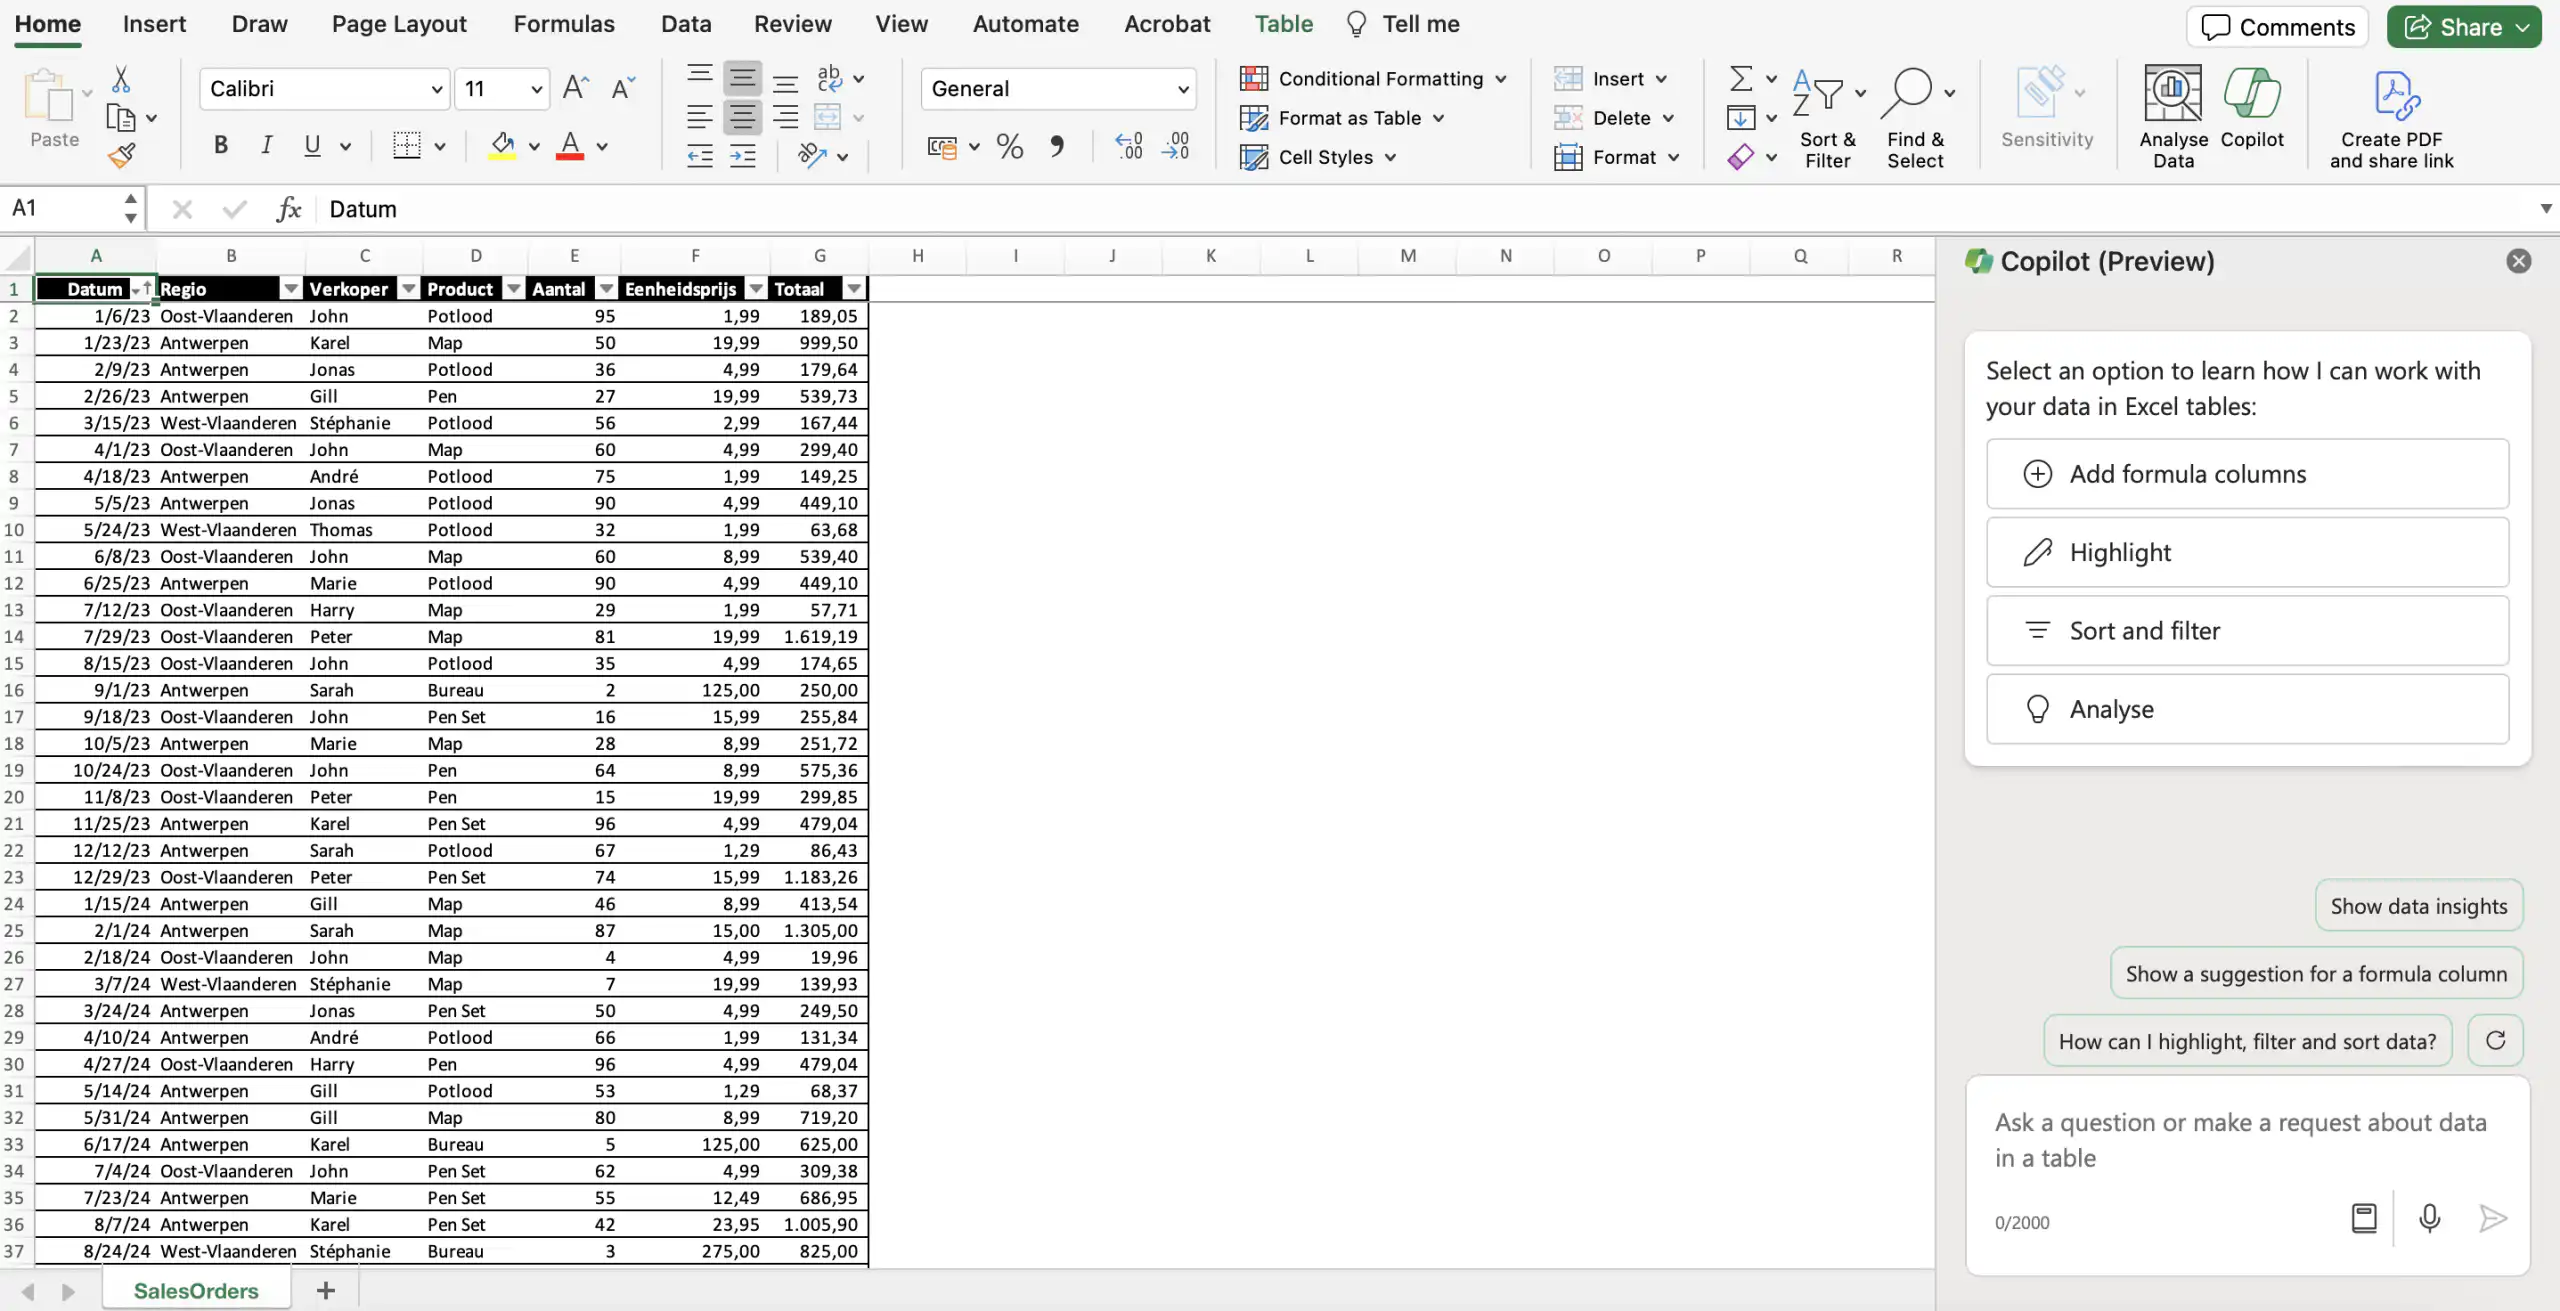
Here are a few prompts to try:
- “Create a line graph showing the revenue for all products in 2024.”
- “Add a new column that calculates the average number of monthly sales per salesperson.”
Copilot Olympics: The Excel Battle!
Generating Insights
Open the Excel document containing the data you want to analyze. Make sure the data is organized in a table. Open the Copilot chat window by clicking the Copilot icon located on the ribbon under the ‘Start‘. Then click ‘Analysis‘…and choose one of the suggested prompts or describe what you want to analyze in a prompt of your own.".
Copilot analyzes the data and displays the insights in a chart, pivot table, summary, trends, or outliers. Select “Add to a new sheet”to add the insights to the Excel file.".
Use the refresh icon to get new suggestion prompts based on the data in your Excel table.
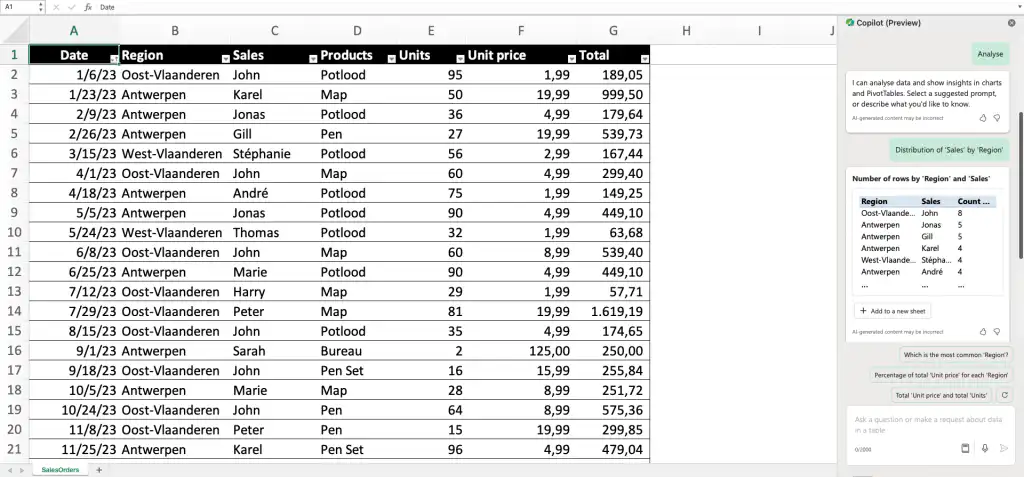
Here are a few prompts to try:
- “Visualize sales by product category.”
- “Show the total sales for each product.”
- “Show the total ad sales for the ‘East Flanders’ region for the first quarter of 2024.”
Generate all insights
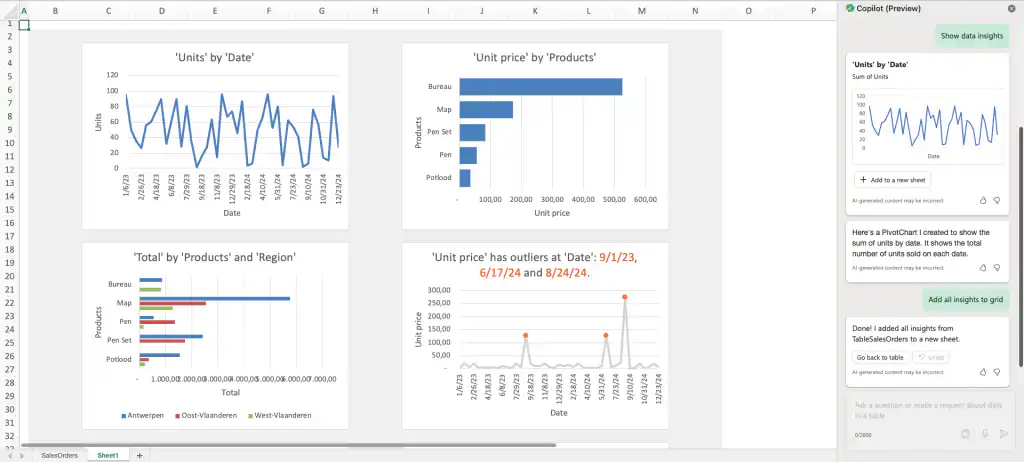
Get all the insights from your table using the ‘Show data insights’ prompt. Open your Excel document, format the data into a table, and open Copilot in Excel from the ribbon. Select the suggested prompt or type “Show data insights” and then click or type “Add all insights to the grid“. Copilot creates a new tab with charts and pivot tables to extract all the insights from your data table.
Highlight, Sort, and Filter
Copilot in Excel can highlight data in tables (using conditional formatting), sort it, or filter it to easily draw attention to key insights. Open your Excel document, format the data into a table, and open Copilot in Excel from the ribbon. In your prompt, describe what you want to highlight, sort, or filter.
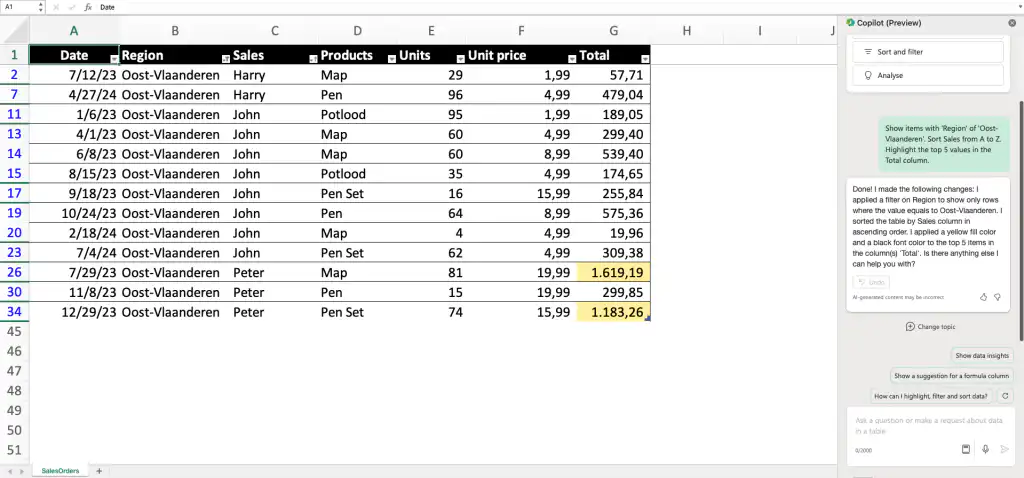
Here are a few prompts to try:
- “Highlight the top 10 values in the ‘Total’ column.”
- “Highlight the highest values in the ‘Unit price’ column.”
- “Sort the ‘Sales’ column alphabetically from A to Z.”
- “Filter the sales for April 2024.”
Generate Formula Columns
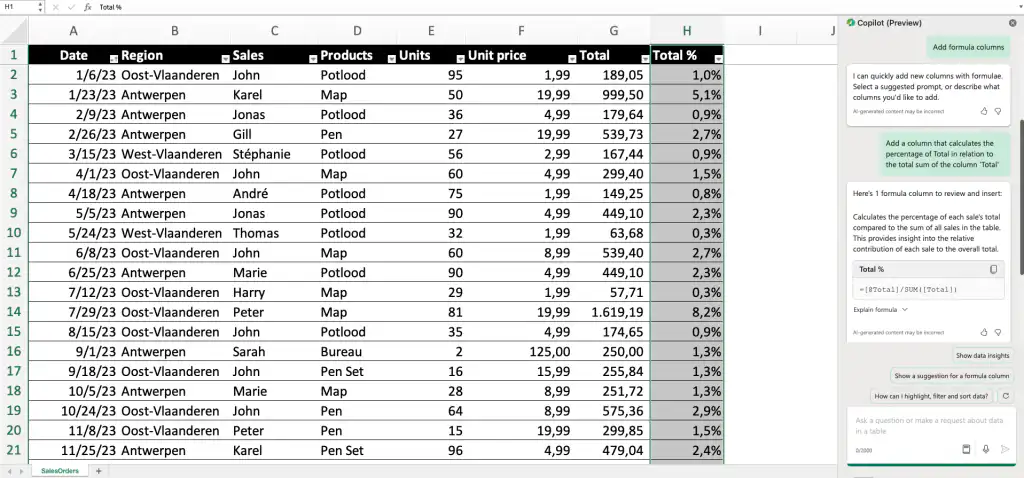
Add columns to your table using calculations based on the data from existing columns. With a formula column, you don’t have to perform each calculation individually for every row. Turn your data into a table and open the Copilot in Excel chatbox from the ribbon. In your prompt, describe which column you want to add based on which data, or choose from one of the suggestions. Then select “Insert column” to add the column.
Here are a few prompts to try:
- Calculate the percentage share of each sale relative to the total in the ’Total’ column.
- Add a column that calculates the total profit for each marketing campaign in 2024.
- Add a column that calculates the number of days between each new sale.
Try these prompts, too
Copilot in Excel is currently in the preview phase, which means its features are still being actively developed and improved. Below are several prompts you can use to start testing Copilot for Excel. Please note that these may not yet function optimally.
Calculations:
- “Find the [average] of the cells in [cell range].”
- “Calculate the total profit for products with a quantity greater than 50.”
- “Find the standard deviation of the dataset in [column H].”
- “Use the SUMIFS function to calculate the total revenue for [specific criteria].”
Cleaning and Validating Data
- “Remove duplicates from [Column A].”
- “Convert the text to uppercase in [column C].”
- “Extract the year from the data in [column D].”
- “Combine first names and last names from [columns E and F].”
- “Split the text in [column G] using the delimiter [,].”
Formatting and data validation rules:
- “Create a rule to highlight cells with values greater than 100.”
- “Use color scales to visualize data trends in the [table].”
- “Set up a data validation rule to allow only whole numbers in column E.”
- “Restrict entries to the specific values ‘High,’ ‘Medium,’ and ‘Low’ in column F.”
Tables and graphs:
- “Create a pivot table to show total revenue by product.”
- “Summarize customer feedback scores using a pivot table.”
- “Create a line chart to show the monthly income growth.”
- “Compare website traffic over the past six months using a line chart.”
- “Show me a breakdown of [Product X] sales for this quarter.”
Join the Copilot Community on Reddit
Are you curious about the latest developments and want to deepen your knowledge of Microsoft Copilot? The Copilot Community on Reddit is where enthusiasts come together to share insights, information, prompts, and new updates. It’s a platform where you can not only learn how to get the most out of Copilot, but also share your own insights. Visit the Reddit Community and join in on lively discussions.